
Open any student and tap View Analytics to see their behavior patterns without waiting for someone to run a report.
Picking a time range
Four buttons across the top: 7 Days, 30 Days, 90 Days, All Time. Everything below re calculates when you switch.
Seven days is useful for "what happened this week." Thirty days is usually the right window for a team meeting. All Time is what you want when you are writing up history.
The four stat cards
| Card | What it means |
|---|---|
| Total Reports | ABC reports for this student in the selected range |
| Escalated | How many of those involved physical restraint |
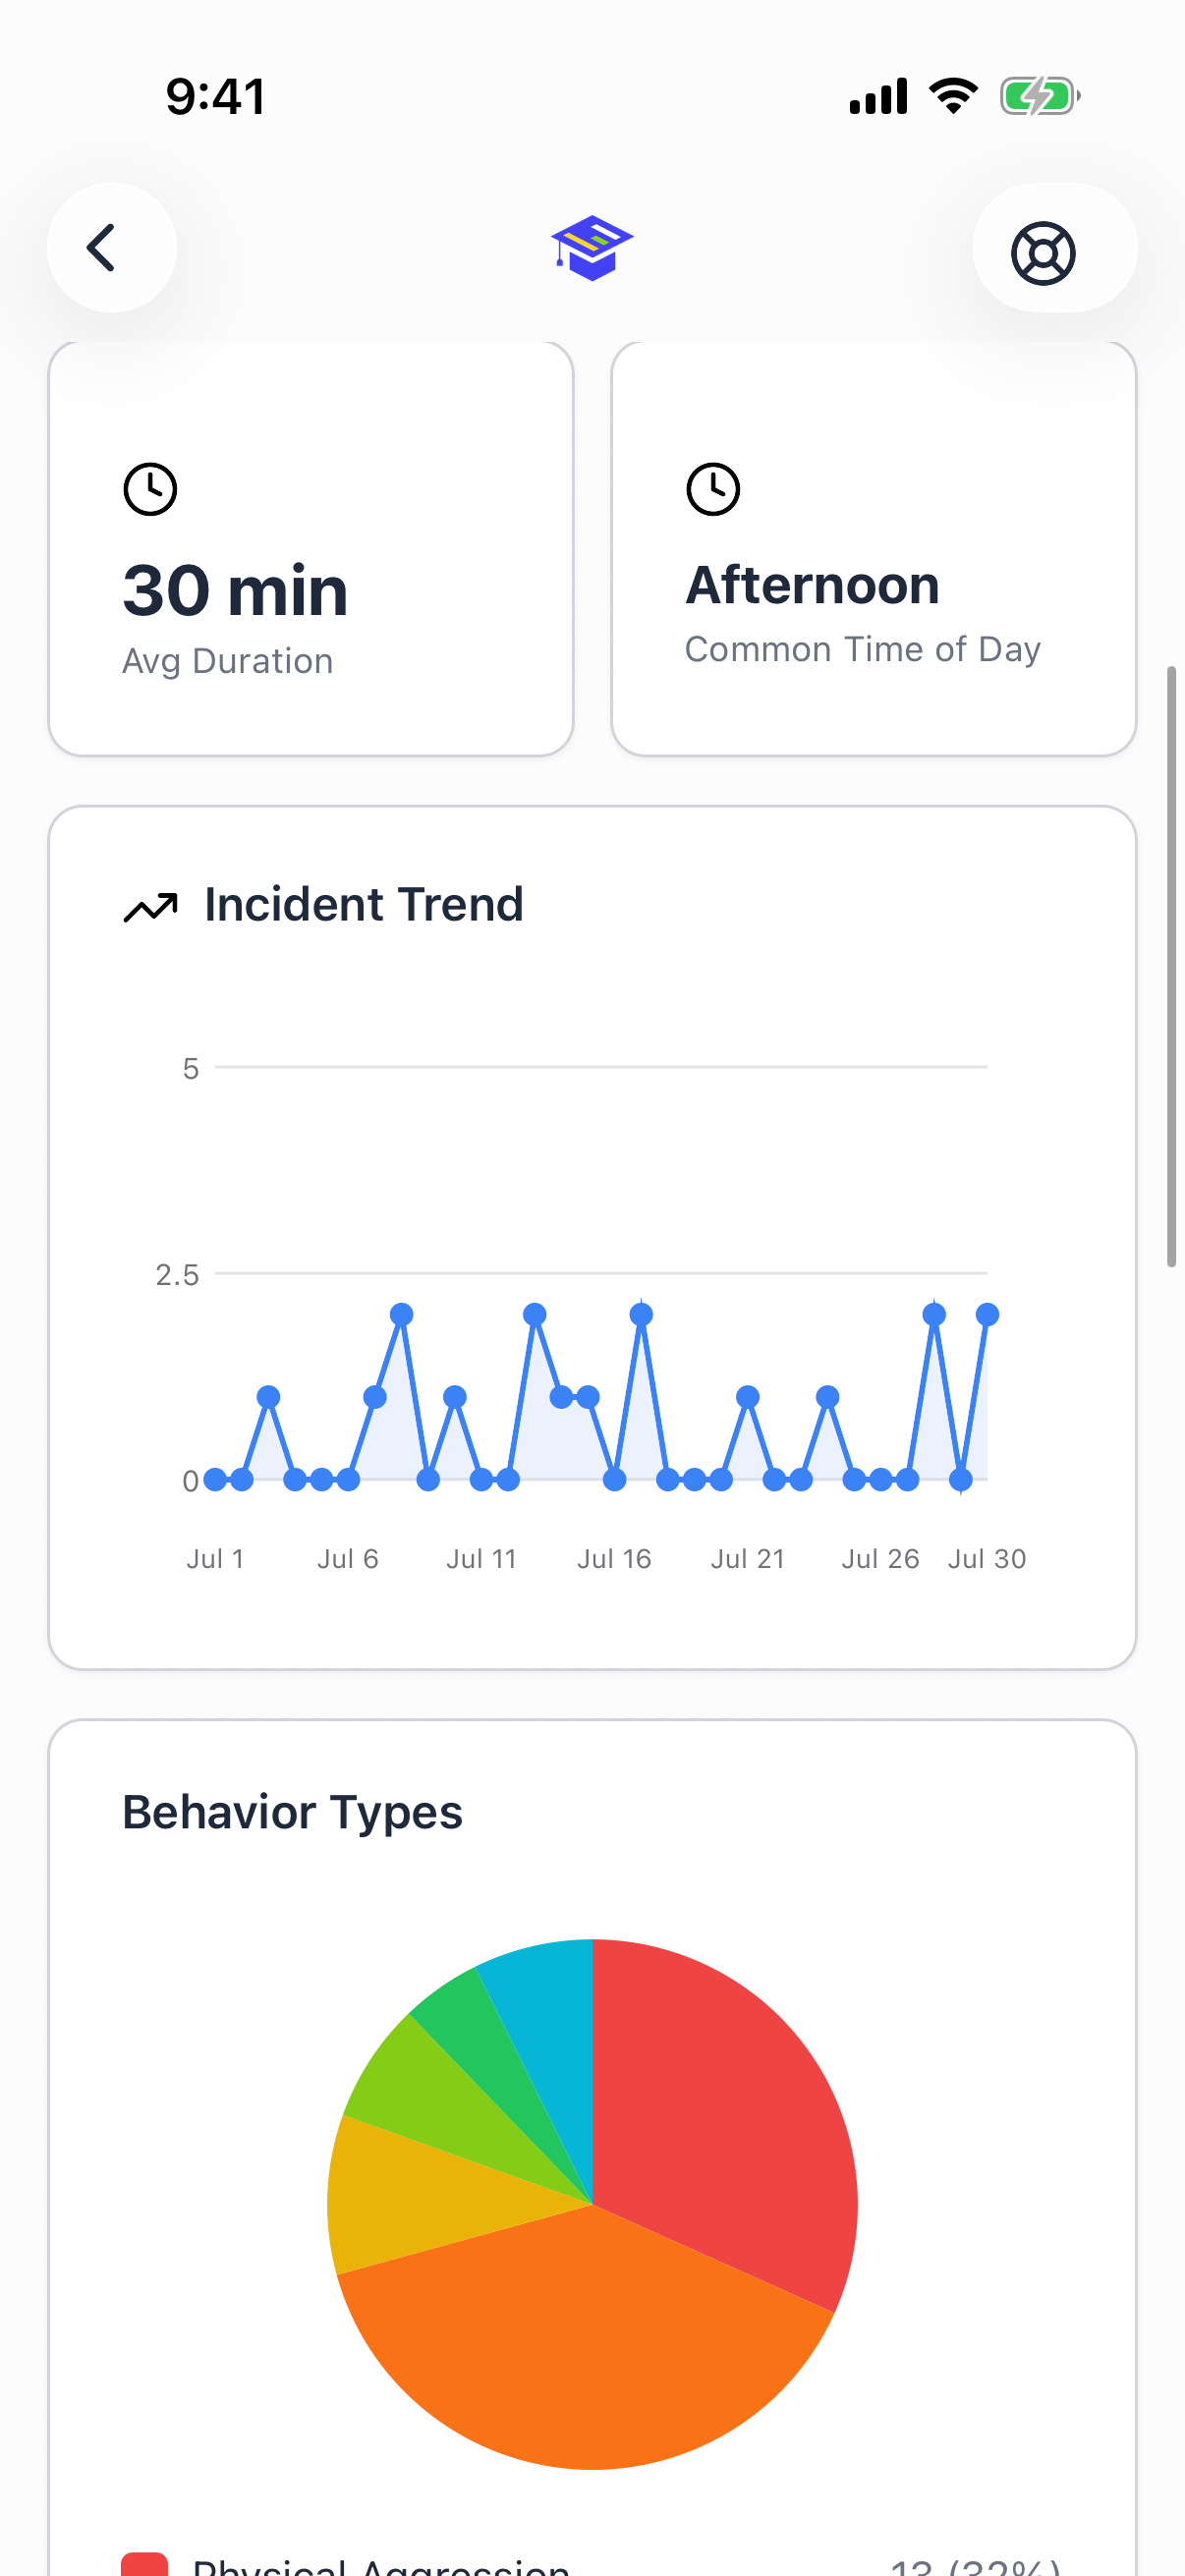
| Avg Duration | Average length of an incident, in minutes |
| Common Time of Day | The period incidents cluster in most |
The charts
Incident Trend. A line showing reports over time. Use it to answer whether things are getting better, worse, or holding steady. Over a 90 day range the points are grouped by week so the line stays readable.
Behavior Types. A pie chart of where the incidents concentrate: maladaptive verbals, physical aggression, noncompliance, self injurious behavior, elopement, property destruction. This is the one that tells you what you are actually dealing with.
Common Antecedents. The triggers, ranked. The top bar is the one worth building an intervention around.
Staff Responses Used. Which consequences staff actually reached for, ranked. Read this next to the antecedents chart. If the top response does not match the top antecedent's function, that is a conversation worth having.
Incidents by Day. Monday through Sunday. Repeating spikes on the same weekday usually point at a schedule, not at the student.
Incidents by Time. Which parts of the day are hardest. Transitions and unstructured time show up here more often than instruction does.
What to do with this
The pattern that matters most is antecedent plus time of day. "Trying to get away from something, clustered right after lunch" is an actionable finding. "Twelve incidents this month" is not.
For the full version of this analysis, with trend lines, phase change markers, and an exportable PDF, generate a data summary on the dashboard. See Data summaries.
Sharing a behavior report as a PDF
When you need to hand someone a document rather than show them a screen, open the student's profile and tap Share Behavior Report (PDF).
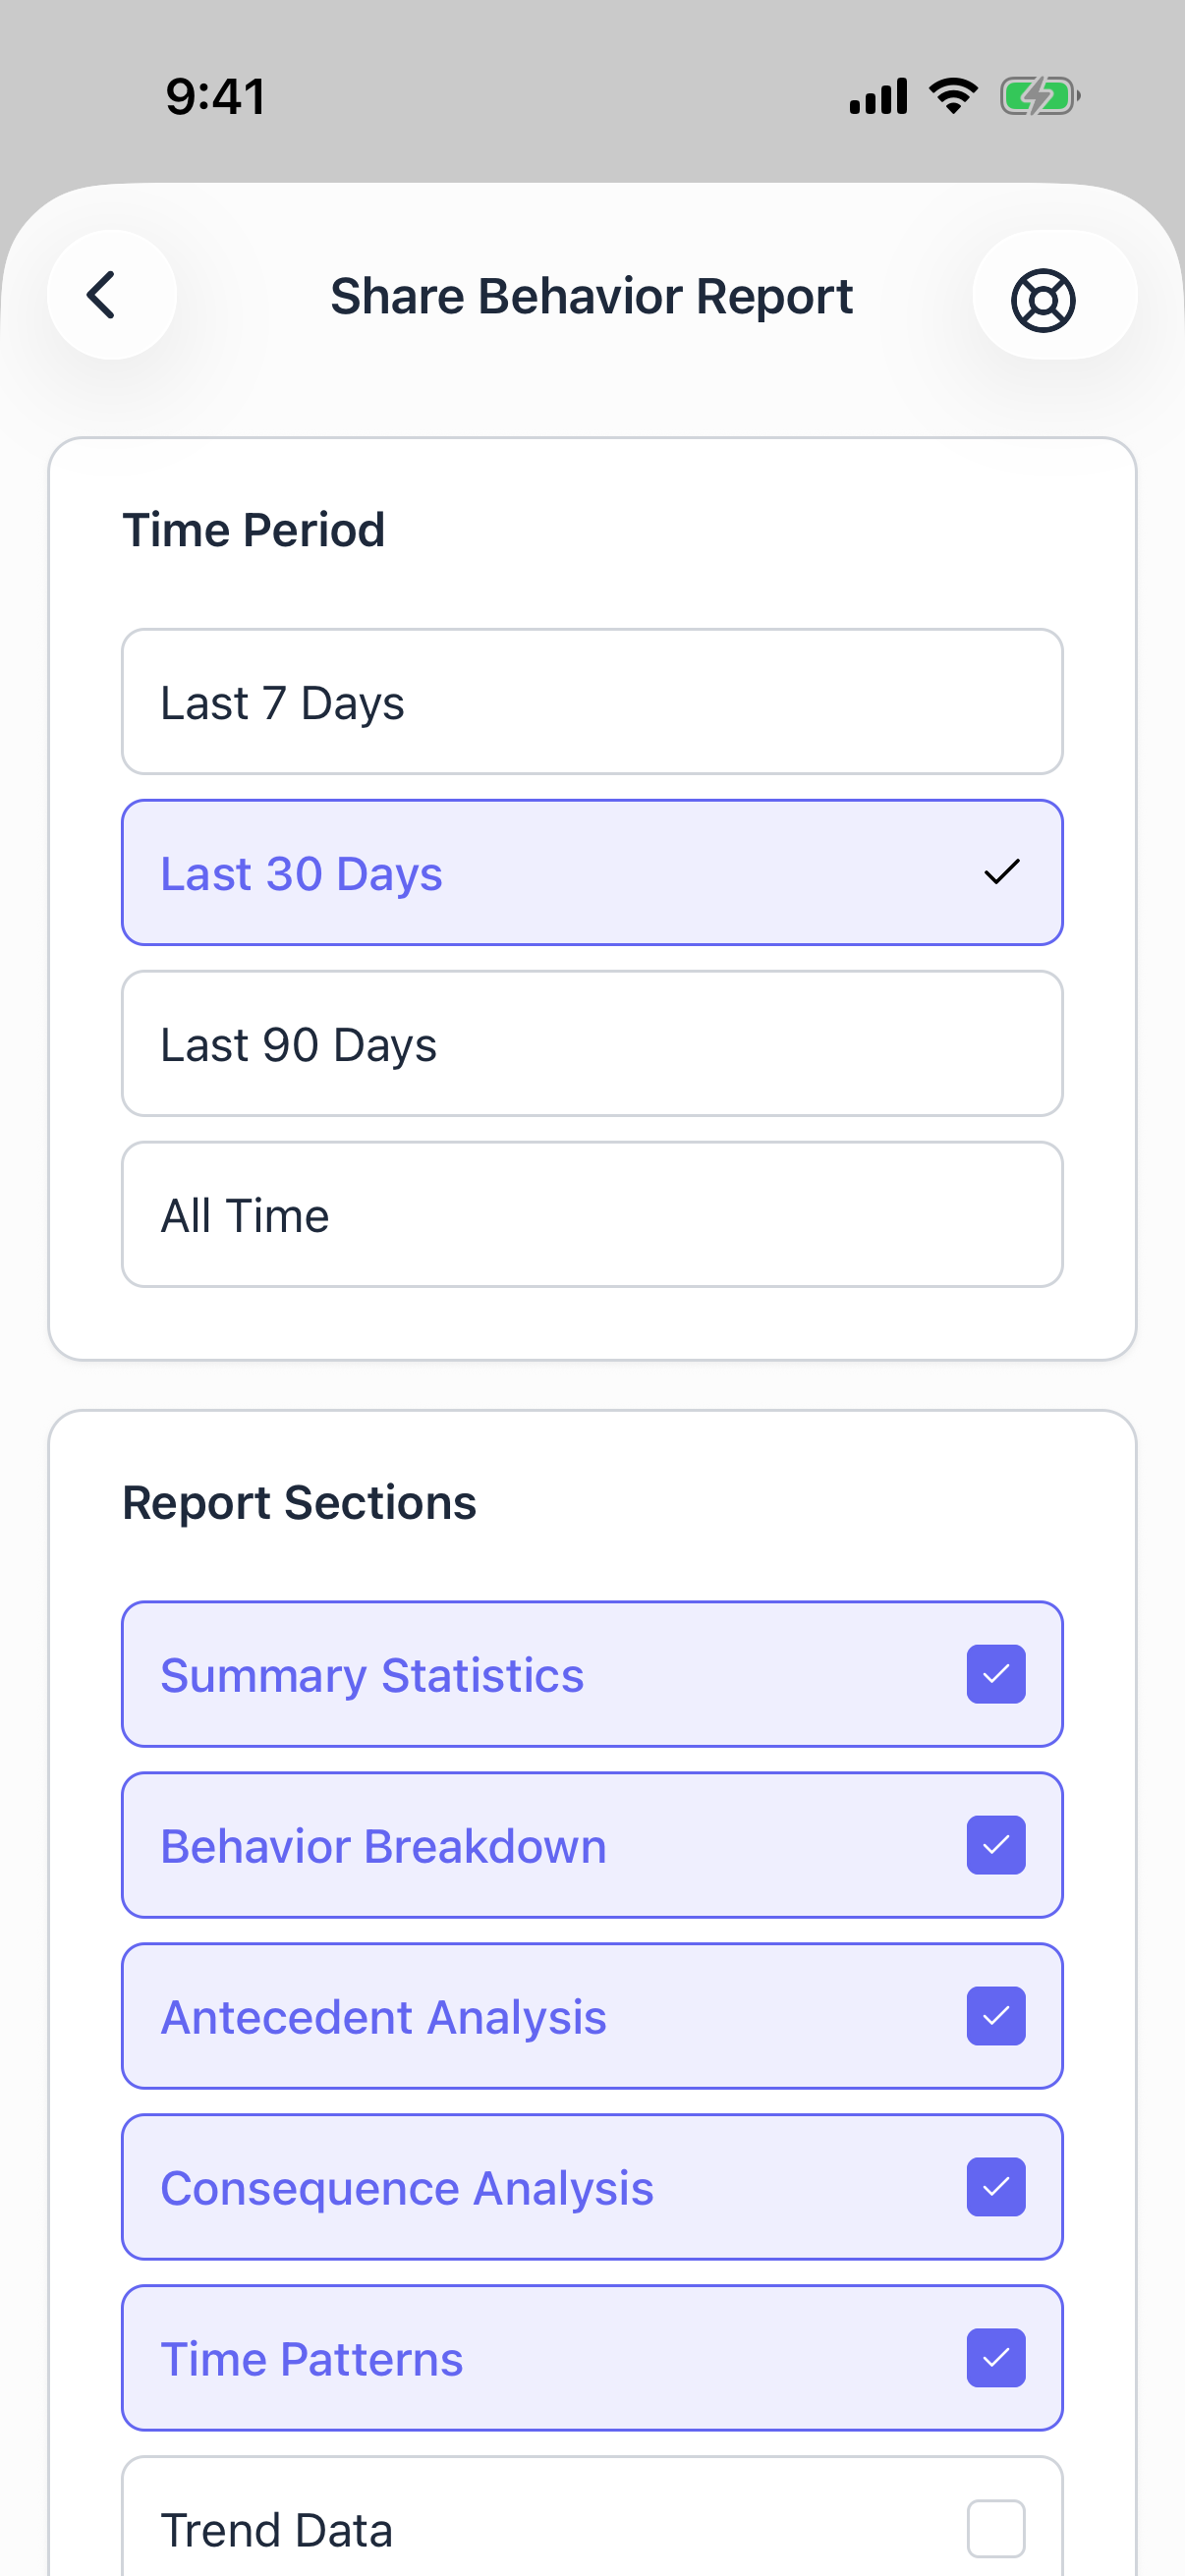
- Time Period. 7 days, 30 days, 90 days, or all time.
- Report Sections. Tick what to include:
- Summary Statistics
- Behavior Breakdown
- Antecedent Analysis
- Consequence Analysis
- Time Patterns
- Trend Data, off by default
- Generate.
The PDF is built on your phone and your share sheet opens, so you can email it, drop it into your files app, message it to a colleague, or send it wherever it needs to go.
Leave out the sections you do not need. A two page report about antecedents and time patterns gets read. A six page report gets skimmed.
This is a student record. Handle the file the way your district handles anything else with a student's name on it.
Generating a data summary
A data summary is different from the PDF above. It is saved to the student, it shows up on the dashboard for anyone with access, and it is what the full charts and the printable export are built from.
- Open the student's profile.
- Tap Generate Report.
- Pick a start date and an end date.
- Generate.
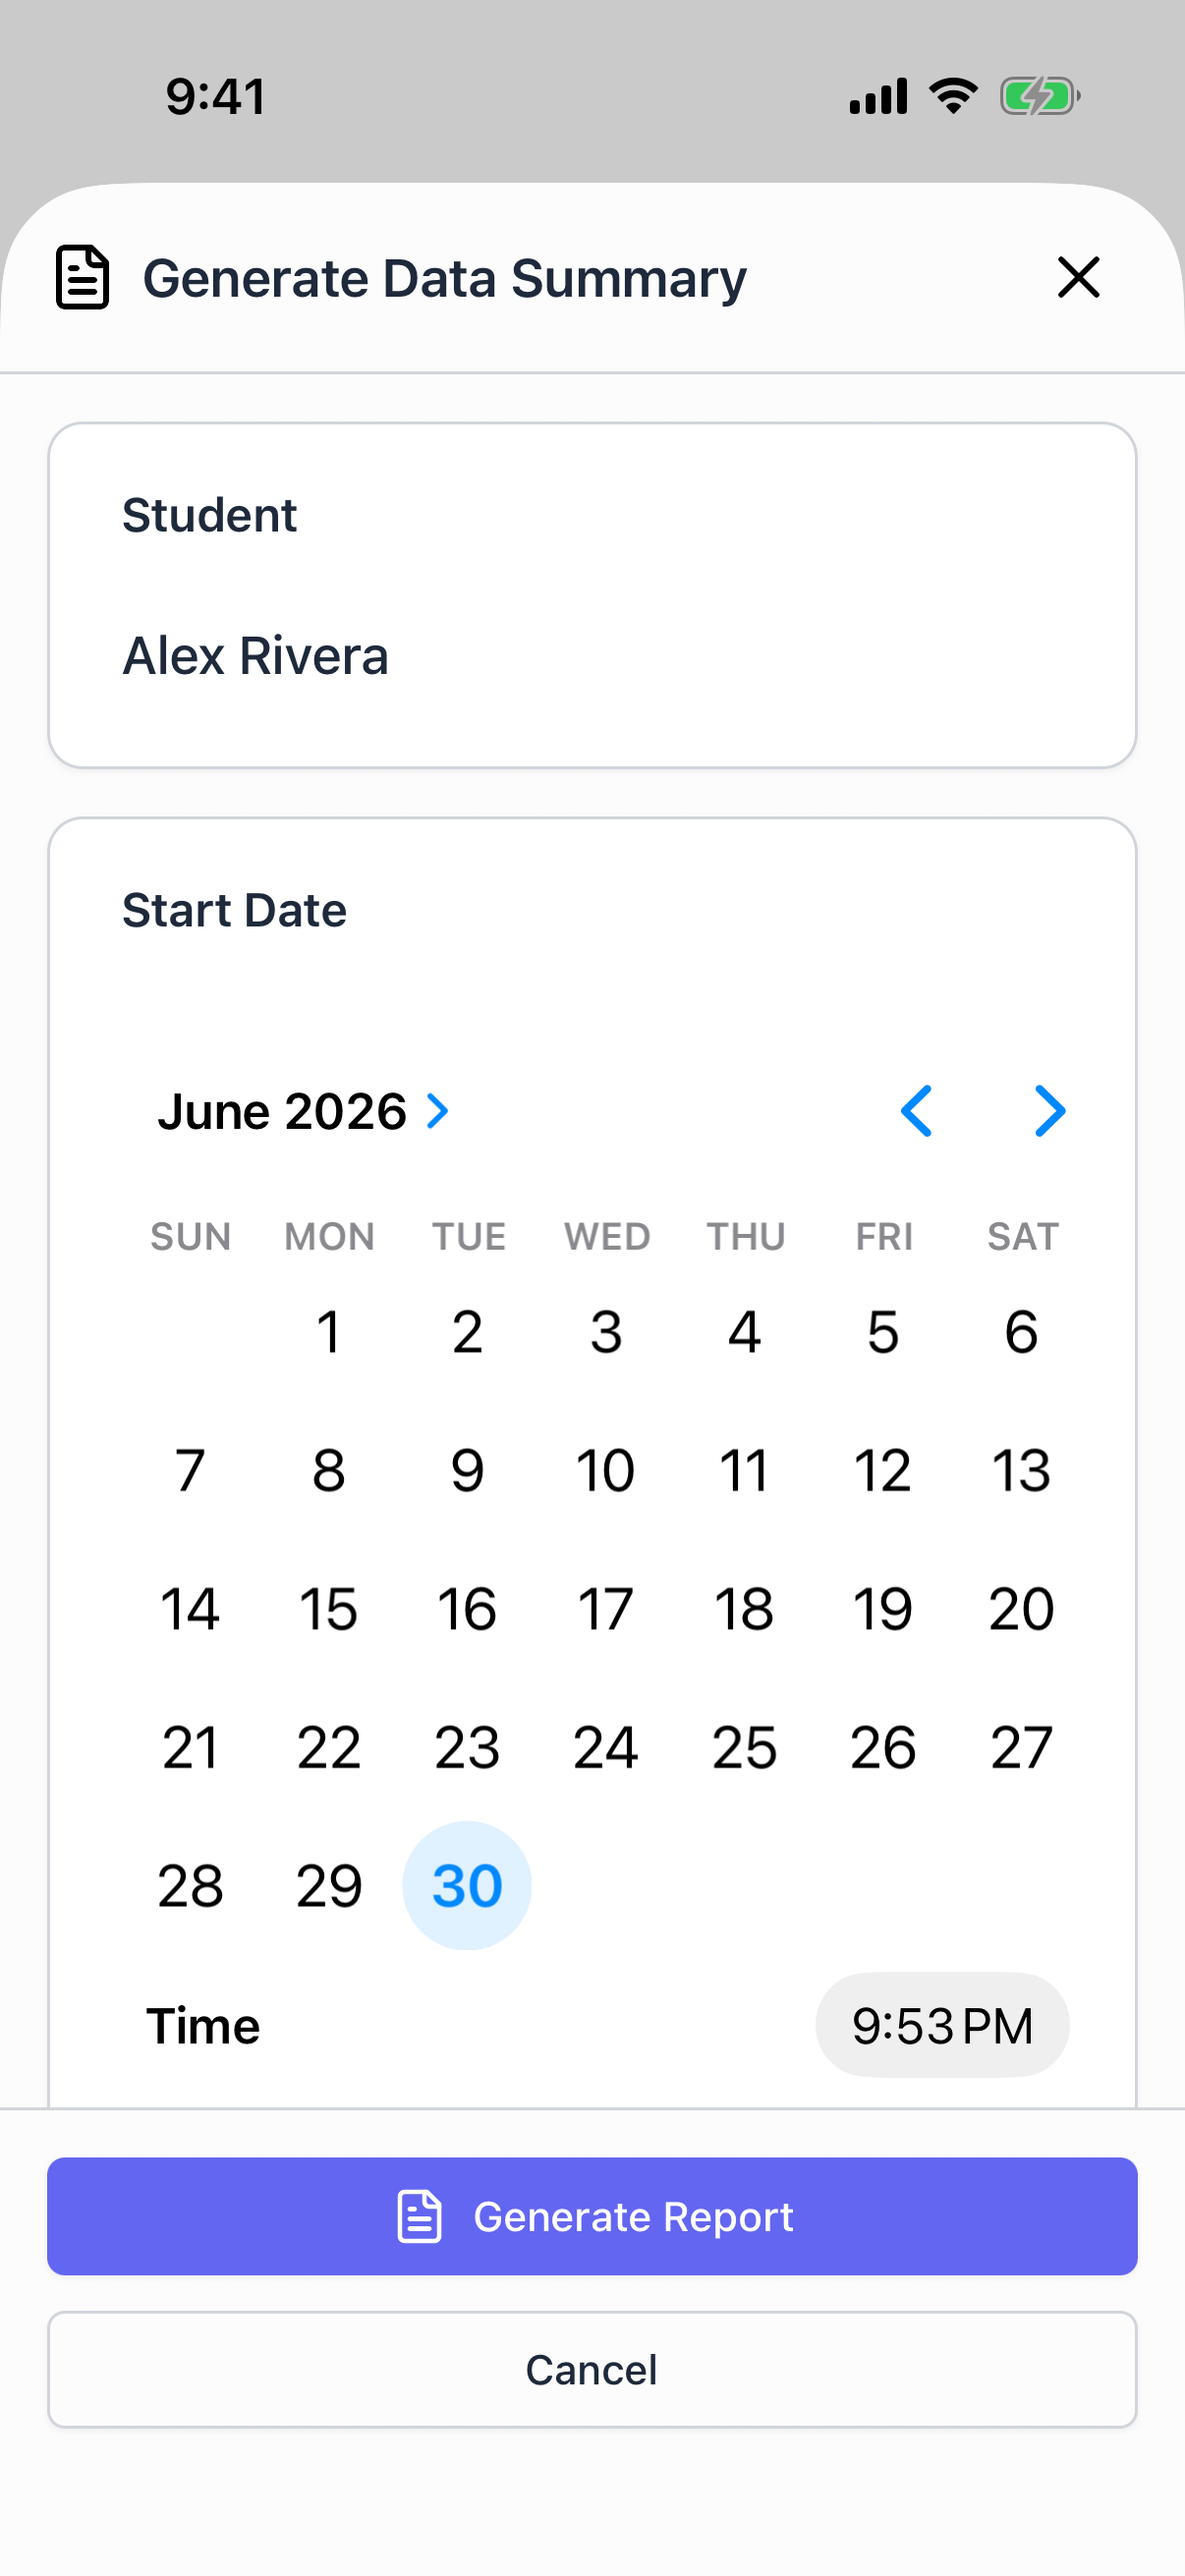
The summary is built on the spot and saved to the student. Open it on the dashboard afterward to see the full charts and export the PDF.
Which one do I want? Share Behavior Report if you need a file right now, on your phone. Generate Report if you want the analysis saved for a meeting, with the full charts and phase change markers.
Who can see analytics
Administrators and district administrators can view analytics for any student at their school. Teachers and itinerant staff can view analytics for the students assigned to them.
If you expect to see a student and cannot, ask an administrator to assign you to them. Any staff member can be assigned, whatever their role.