
The dashboard home page is built around your role. Teachers, school administrators, and district administrators each get a different set of numbers and different charts, chosen for the decisions that role actually makes.
Everything on the page is scoped by the school year selector in the header. If a number looks wrong, check that first.
Quick Actions
School staff see a Quick Actions card at the top: Create ABC Report, Create Intervention, and View Drafts once you have any, with a count.
Filing a report is the thing most people open SPEDup to do, so it sits on the first screen rather than two clicks away. These are the same shortcuts as the home tab in the mobile app. See Writing reports.
District and super administrators do not see this card. Reports are filed by staff at a school, and those accounts are not attached to one.
If you are a teacher
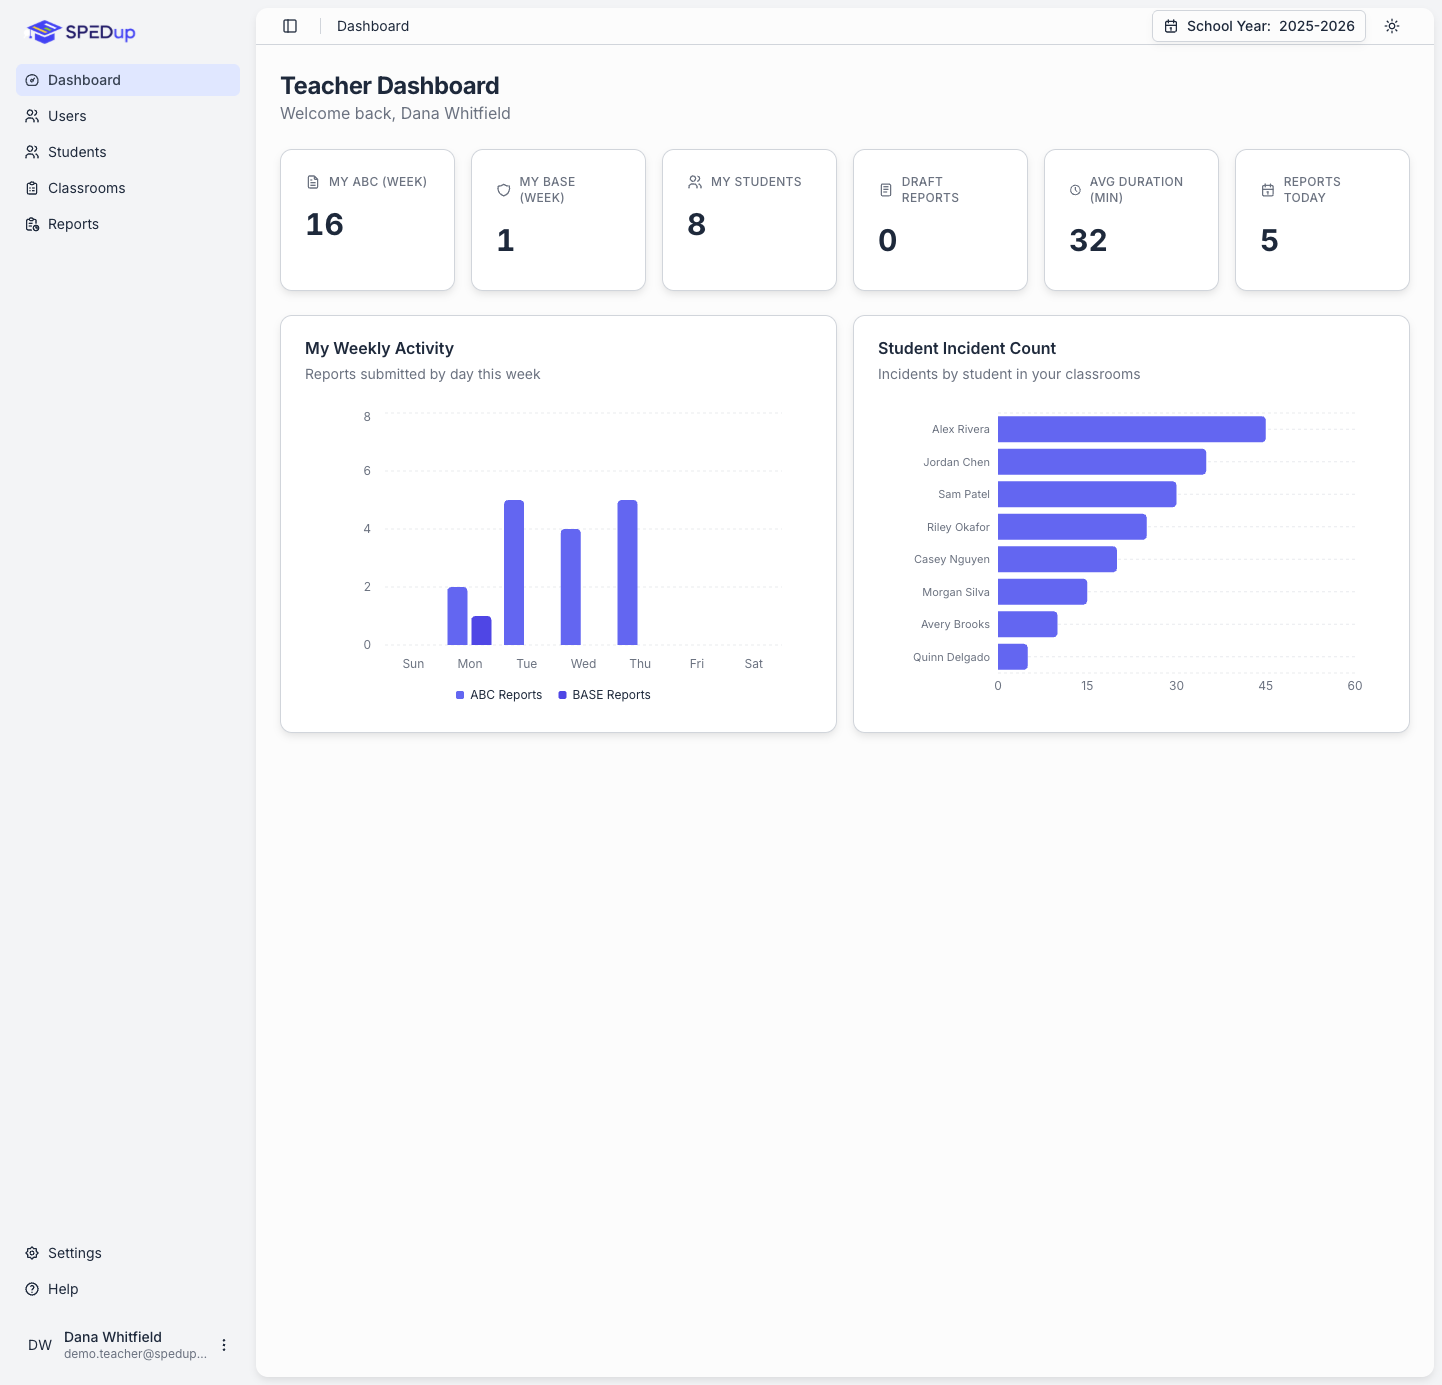
Your dashboard is about your own documentation, not the building's.
| Card | What it counts |
|---|---|
| My ABC (Week) | Your ABC reports this week |
| My BASE (Week) | Your intervention reports this week |
| My Students | Students assigned to you |
| Draft Reports | Your unfinished ABC and intervention drafts, combined |
| Avg Duration (min) | Average incident length across your reports |
| Reports Today | Your submitted reports since midnight |
My Weekly Activity breaks your ABC and intervention reports out by day of the week. It shows your documentation rhythm. A Friday cliff is a real pattern worth knowing about.
Student Incident Count ranks your top ten students by incident volume, drawn only from students in your classrooms. This is your "who needs attention right now" list.
If Draft Reports is not zero, go finish them. Drafts do not count anywhere else and they are not visible to administrators.
If you are a school administrator
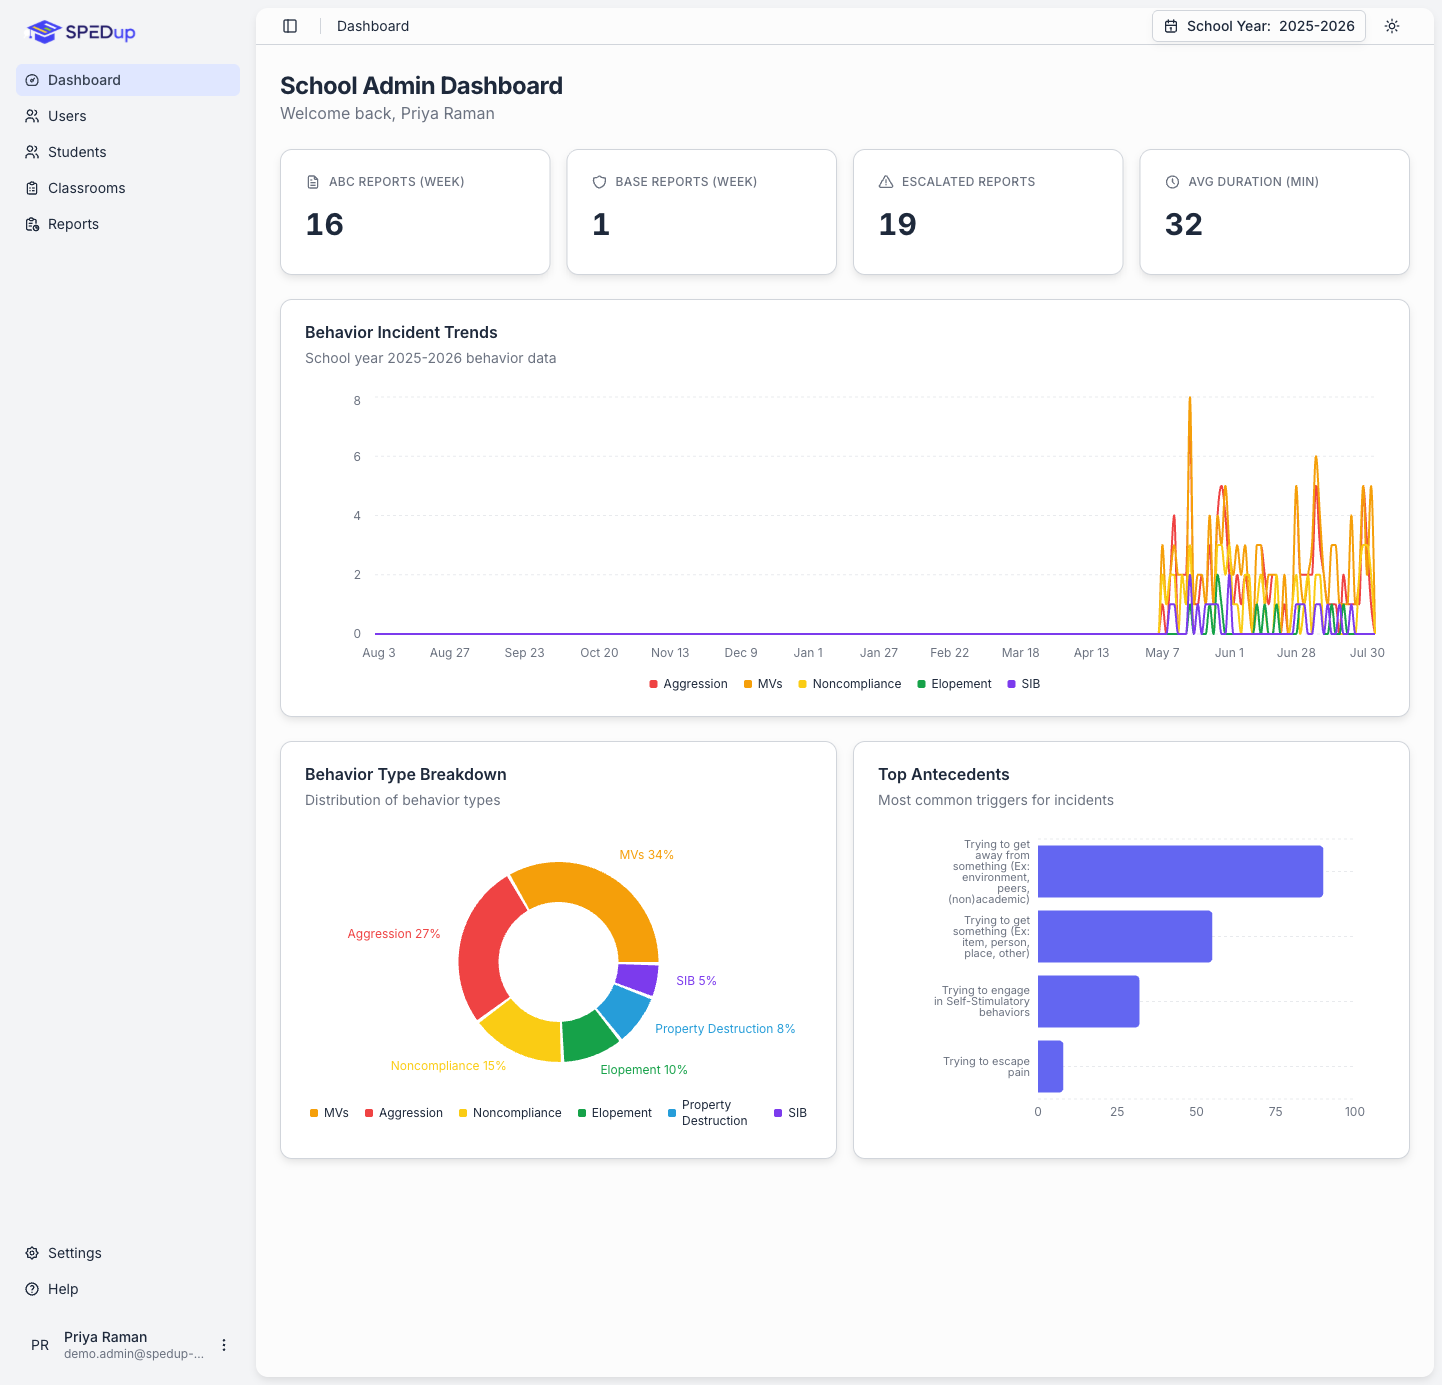
Your dashboard is about your building.
| Card | What it counts |
|---|---|
| ABC Reports (Week) | All ABC reports at your school this week |
| BASE Reports (Week) | All intervention reports this week |
| Escalated Reports | Reports involving physical restraint, within the selected school year |
| Avg Duration (min) | Average incident length across the school |
Behavior Incident Trends plots five behavior categories as separate lines over the last thirty days. Weekends are excluded on purpose. Leaving them in makes the normal weekly instructional rhythm look like a recurring behavioral pattern, which it is not.
Behavior Type Breakdown shows where your building's incidents concentrate by category.
Top Antecedents ranks the eight most common triggers. This is the chart to bring to a staff meeting. If one antecedent dominates the building, that is an environmental or scheduling conversation, not a student by student one.
Escalated Reports is the number to watch. Every one of them is a restraint, and every one is flagged automatically at submission.
If you are a district administrator
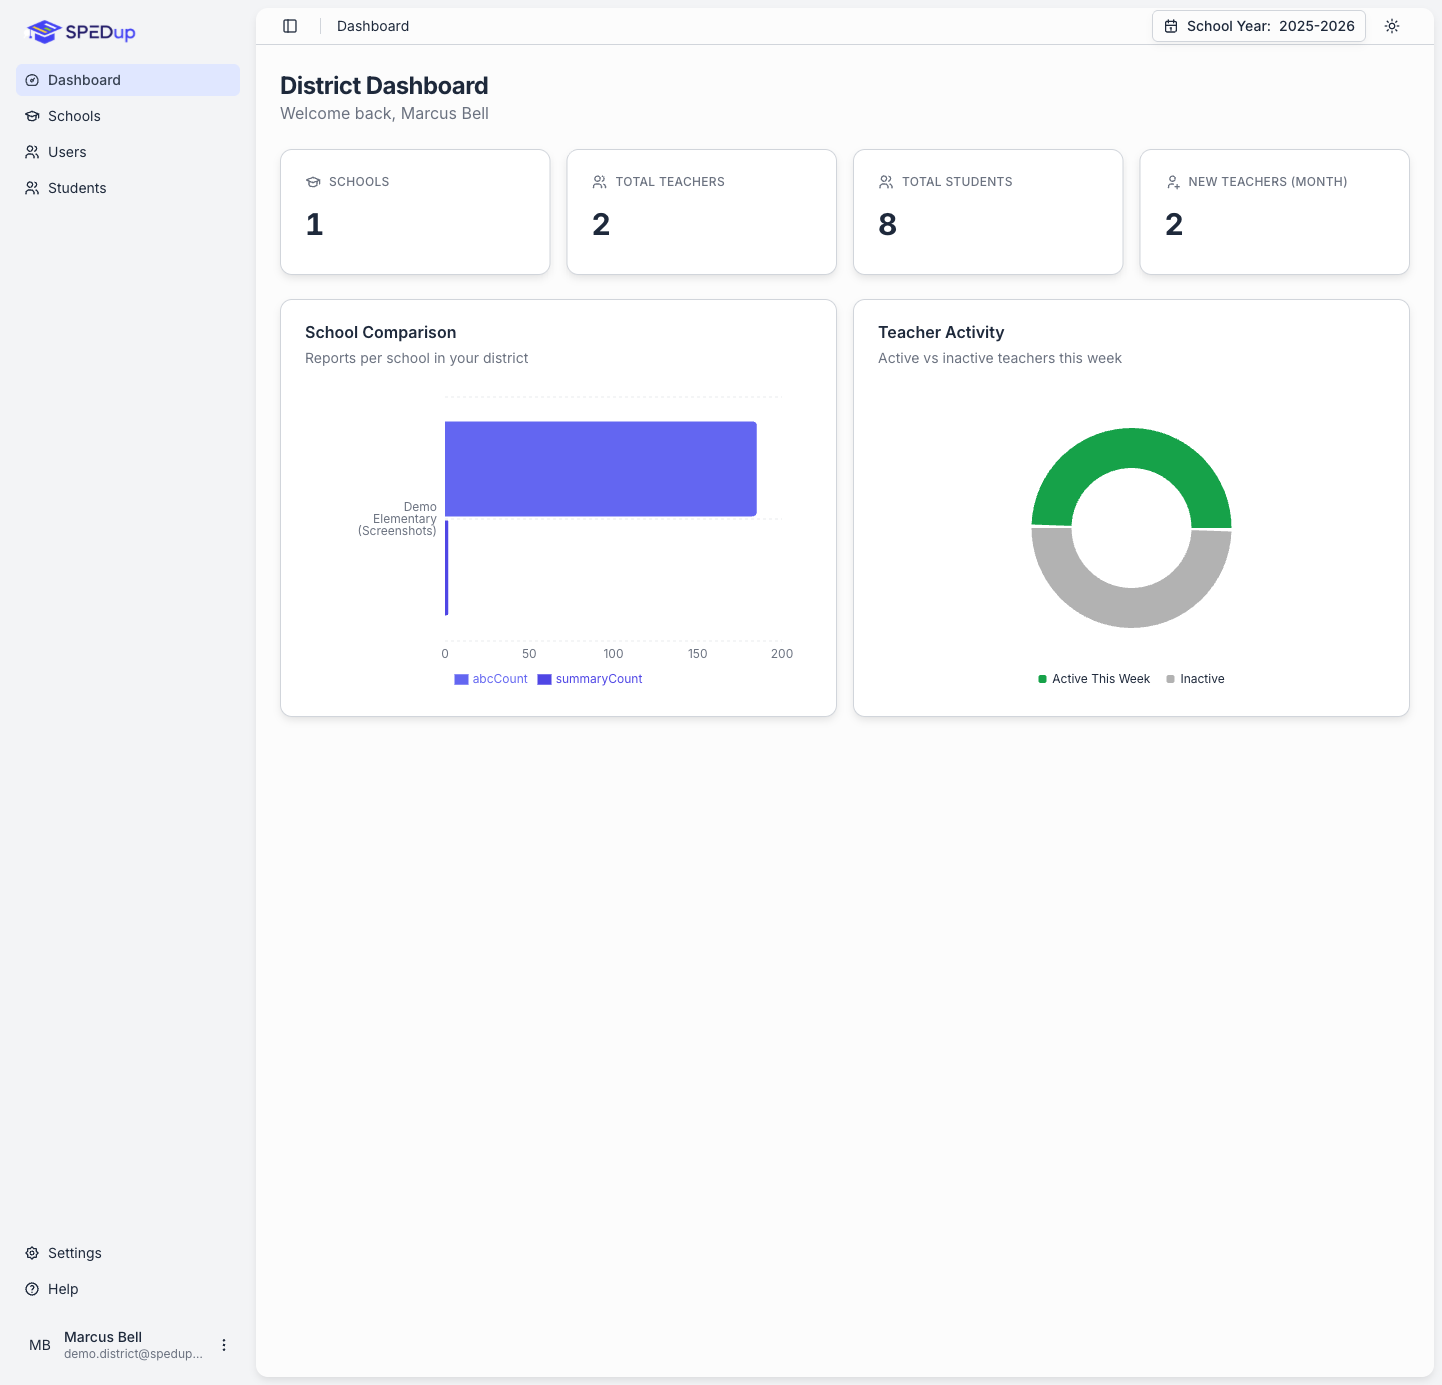
Your dashboard is about coverage and adoption across your schools.
| Card | What it counts |
|---|---|
| Schools | Schools in your district |
| Total Teachers | Teachers across the district |
| Total Students | Students across the district |
| New Teachers (Month) | Accounts created since the first of this calendar month |
Teacher Activity splits your teachers into active and inactive for the current week. Active means they filed at least one report. The week starts Sunday.
School Comparison shows ABC reports and data summaries per school.
Every school stays on the School Comparison chart, including ones with no activity at all. A school with zero bars renders as a thin sliver rather than disappearing. That is deliberate. A building that stopped documenting is the most actionable thing on the chart, and a top ten view would hide exactly that.
What every number means
| Metric | Definition |
|---|---|
| Week | The current week, starting Sunday |
| Month | Since the first of the current calendar month |
| Avg Duration | Mean of end time minus start time across ABC reports in the period, in minutes |
| Escalated | Reports flagged for administrator review because restraint was recorded |
| Draft Reports | Unfinished reports, ABC and intervention combined, owned by you |
| Reports Today | Your submitted reports since local midnight. Drafts do not count |
| Active teacher | Filed at least one report in the current week |
| Inactive school | Zero submitted ABC reports in the trailing thirty days |
If a number looks wrong
- Check the school year selector. This is the answer most of the time.
- Check whether drafts are involved. Almost every count excludes drafts. A teacher with five drafts and no submissions counts as zero.
- Check the window. "Week" means this week, not the last seven days. On a Monday morning, weekly counts are supposed to be low.
- Check your assignments. Teacher cards are scoped to the students and classrooms you are assigned to. Missing assignments make your dashboard look emptier than reality.